|
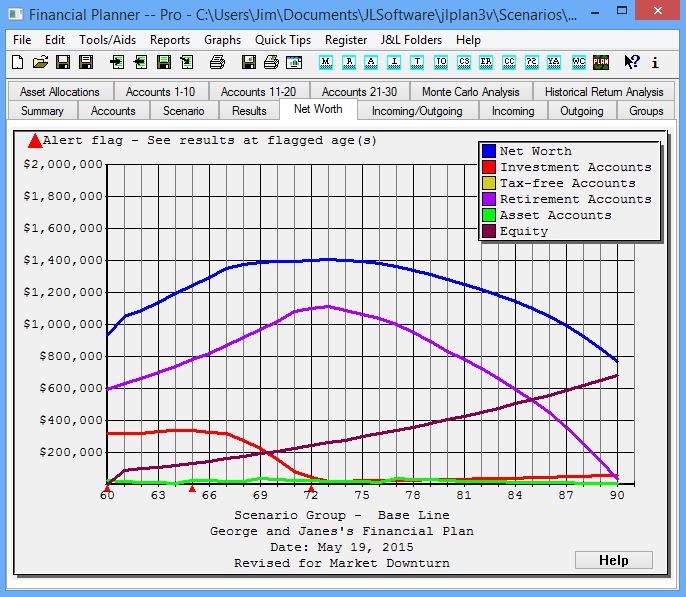
The Net Worth Graph graphs your Net Worth along with its components, savings, assets, and equity
for each of your ages in the Financial Scenario.
The Net Worth graph as well as all of the graphing folders have the following functionality:
- You can toggle between the line graph, bar graph and 3D bar graph by
double clicking the right mouse button.
- You can toggle between the line/bar graph and the pie graph by double clicking the left mouse button.
- You can display values on the graphs by pressing the left mouse button any time the cursor is a cross hair as opposed to an arrow.
- You can toggle the graph legend in front of or behind the plots by pressing the "L" key.
- Alternative Method: You can also toggle this by shift-left clicking on the legend.
- You can remove the legend from the graph by pressing the "N" key. To get the legend back press the "L" key.
- Alternative Method: Left click on the legend. To get the legend back left click where the legend was last positioned.
- You can display Scenario Event Name(s) (label(s)) at the age they start and end by pressing the left mouse button while the cursor is positioned on either the Start Age or End Age of the event(s). The label(s) will remain only as long as the mouse button is depressed. The Event will be outlined in green at the Start Age and red at the End Age
If you want the label(s) to remain press the Ctrl key before the mouse button.
As long as the label(s) are present on the graph they will be printed with the graph.
Changing graph types, printing a graph, and changing folders remove the label(s) from the graph.
- You can Right Click the mouse on any of the Account Types in the legend to display the accounts represented by that Account Type. This applies also to the legend when the pie graph is displayed.
- When the pie graph is displayed a Right Click on any of the pie segments will display the accounts associated with that Account Type.
Printing Graphs
Three ways to print a graph generated by the program are as follows:
- Open the graph folder and click the Print Current Graph icon.
- Open the graph folder.
Press the Alt key simultaneously with the PrtSc key. This puts the graph into the clipboard.
Open your favorite image software, the Window's Paint program, or even a word processor, and Paste the graph from the clipboard.
- Open any folder and press the Ctrl key simultaneously with the "p" key. This will print the entire folder to the default printer.
Line Width
You can change the line widths on each of the graphs by pressing the Alt key simultaneously with the F7 key to increase the line width and the Alt key with the F6 key to decrease the line width.
Note: This also affects the line width of the printed graphs.
Zooming
You can zoom in on any of the Line Graphs, except the Summary, by performing the following steps:
-
Hold the Shift Key down and simultaneously press the left mouse button while the arrow or cross cursor is within the graph.
This will create a rectangular box on the graph outlining an area to be re-graphed.
This area will be defined from the y-axis to the cursor and the x-axis to the cursor.
- To define an area away from the y-axis position the cursor to another location, hold the Shift Key down and press the left mouse button again.
Hold the Shift Key down and press the right mouse button to re-graph the outlined area.
- To revert back to the original graph hold the Shift Key down and press the right mouse button again.
Bitmaps
Each time a Graph Folder is opened a bitmap of that graph is generated and stored in the Reports folder on your
disk drive. It has the name current.bmp. You can open the Reports folder from the J&L Folders menu.
Double clicking the graph's icon in the Reports folder should display the bitmap in Window's Paint Program.
Floating Child Folders
You may create a "floating" child window from any of the Graph Folders.
You create the window by right clicking on the Graph's tab. While the floating window is displayed it will
update to any changes to the parent folder.
NOTE: This feature is not active when the graph is displaying a Pie Graph.
|